Annual Financial Reports#
The City of Fort Collins' Finance Department publishes the results of its annual audit as well as a comprehensive report of financial statements.
2024 Popular Annual Financial Report#
-
The City of Fort Collins is a full-service municipal organization dedicated to providing exceptional service for an exceptional community of 170,000 residents, 8,000 businesses and numerous community partners.
Located in Northern Colorado, Fort Collins is home to Colorado State University (CSU), outstanding public school and healthcare systems, several large high-tech employers and leading businesses in the craft brewing industry. Fort Collins offers exciting recreational opportunities, unique cultural offerings and amenities, and is a regional center for employment and commerce. Both the City organization and community at large are frequently recognized for our quality of services and amenities, sustainable management practices, and forward-thinking, innovative culture.
One of the City of Fort Collins’ primary responsibilities is to steward taxpayer dollars to provide the programs and services the community expects and deserves from its local government. The Popular Annual Financial Report is part of this commitment to financial transparency.
-
This report provides a condensed and simplified overview of the City's financial position, based on information from the 2024 Annual Comprehensive Financial Report. This report is unaudited and is presented on a non- Generally Accepted Accounting Principles (GAAP) basis, as it does not provide all of the necessary financial statements and note disclosures required by GAAP. As a result, the Balance Sheet and Income Statement presented here are not in strict conformity with GAAP. The Annual Comprehensive Financial Report is a more detailed and complete financial presentation, which is prepared in conformity with GAAP and is audited by the City’s independent auditors, Plante Moran, PLLC. This report summarizes more than 200 pages of the Annual Comprehensive Financial Report’s financial and statistical data. The financial statements condense information of all funds included in the “Total Primary Government.”
This report also includes information on the Fort Collins Urban Renewal Authority, a legally separate, blended component unit of the City, which is therefore included in the City’s governmental activity figures. It excludes discrete component units and fiduciary fund information.
-
- Assets — what the City of Fort Collins owns.
- Business-type activities — private sector-type operations, such as Utilities and Golf, where fees for services typically cover all or most of the cost of operations, including depreciation.
- Capital assets such as City or Utility land, construction in progress, equipment, infrastructure and buildings, and improvements net of depreciation.
- Component Unit — legally separate organizations for which the City is financially accountable. The Urban Renewal Authority, Downtown Development Authority, General Improvement Districts #1 & #15, and the Tourism Improvement District are the City’s component units.
- Current and other assets — items such as pooled cash and investments, cash and investments with fiscal agents, receivables, internal balances, inventories, deposits with others, prepaid items and deferred charges.
- Deferred inflows — an acquisition of a net asset that is applicable to a future reporting period.
- Deferred outflows — a consumption of a net asset that is applicable to a future reporting period.
- Fiduciary fund — accounts for assets held on behalf of outside parties, including other governments.
- Governmental activities — City basic services, including police, planning, economic development, and culture and recreation. Sales, use, and property taxes finance the majority of these services.
- Invested in capital assets, net of related debt—amounts invested in capital assets less accumulated depreciation and any outstanding debt used to acquire these assets.
- Liabilities — what the City of Fort Collins owes.
- Long-term liabilities such as bonds, loans, compensated absences, and other City of Fort Collins obligations.
- Netbook value — represents the acquisition cost less accumulated depreciation for an asset.
- Net position — the difference between City of Fort Collins assets and liabilities. It is the net worth of the City.
- Other liabilities — items such as payables, payroll, accrued interest and unearned revenue.
- PILOT — payment in lieu of taxes, made to compensate the primary government for some or all of the tax revenue lost due to the tax-exempt status of the City’s utilities.
- Primary government — all of the governmental and business-type activities belonging to the City of Fort Collins excluding the discretely presented component units and fiduciary funds.
- Restricted — funds that are not available for general use because they have been set aside for a specific purpose or project.
- Unrestricted — one-time funds available to use for operations or capital.
-
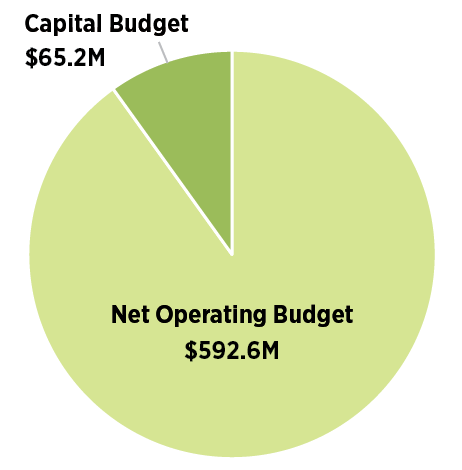
![pie chart of operating budget]()
$657.8M (as amended)
Net Operating Budget: $592.6M
Capital Budget: $65.2M
Fort Collins Financial Results#
-
The net position, or net worth, of the City on December 31, 2024, was $2.29 billion. Of the net position balance, $453.1 million is unrestricted and is available to meet ongoing obligations in accordance with the City’s fund designations and fiscal policies.
The City’s net position increased from the prior year by over $103.6 million (4.7%). The governmental net position increased by $68.0 million (5.4%) and the business-type position increased by $35.5 million (3.8%).
The City’s total long-term liabilities decreased in 2024 by $17.7 million (5.5%) during the current year. Within that activity, the City’s governmental long-term liabilities decreased by $5.4 million (8.3%) and business-type long-term liabilities decreased by $12.3 million to (4.8%).
NET POSITION
(at Dec. 31 in thousands*)
Governmental
2023
Governmental
2024
Business-type 2023
Business-type
2024
Total Primary Government
2023
Total Primary Government
2024
ASSETS
Current and other assets
$ 416,377
$ 437,820
$ 345,524
$ 349,464
$ 761,901
$ 787,284
Capital assets
1,017,347
1,046,150
877,040
905,576
1,894,387
1,951,726
Total assets
1,433,724
1,483,970
1,222,564
1,255,040
2,656,288
2,739,010
Deferred outflows of resources
694
226
911
457
1,605
683
LIABILITIES
Long-term liabilities
65,289
59,871
257,402
245,111
322,691
304,982
Other liabilities
69,077
54,469
40,636
48,547
109,713
103,016
Total liabilities
134,366
114,340
298,038
293,658
432,404
407,998
Deferred inflows of resources
42,692
44,446
-
864
42,692
45,310
NET POSITION
Net investment in capital assets
953,348
986,986
718,831
723,768
1,672,179
1,710,754
Restricted
93,562
122,498
-
-
93,562
122,498
Unrestricted
210,451
215,924
206,606
237,208
417,057
453,132
TOTAL NET POSITION
$ 1,257,361
$ 1,325,409
$ 925,437
$ 960,975
$ 2,182,798
$ 2,286,384
*Totals may not add due to rounding.
-
Governmental program revenues increased over 2023 by $0.1 million, or 0.1%, sales & use tax revenues increased by $25.2 million, or 14.1%, and Governmental expenses increased by $10.2 million, or 3.1%, over 2023. The increase in program revenue is attributed to operating grants and contributions through the American Rescue Plan Act Coronavirus Local Fiscal Recovery Fund, which is federal awards relating to COVID-19 that fund a broad range of core governmental services and community programs. Other increases to program revenue include rising City investment gains over 2023, as well as increases to charges for services as demand for services continues to rise across a variety of programs and activities.
On the business-type side, program revenues and other general revenues increased in total by $31.7 million with expenses increasing by only $12.9 million over 2023. This 11.5% increase to revenues was largely driven by Electric & Telecommunication revenues for the build out of the Connexion internet service and increased electric rates and consumption. Other increases include higher Wastewater revenues for commercial and industrial demand, as well as higher residential and commercial segment demand for increased Storm drainage utilities.
Expenses are described in greater detail in the following pages. For in-depth analysis and multi-year trends of revenues & expenses, see the 2024 Annual Comprehensive Financial Report.
CONDENSED SUMMARY OF ACTIVITIES
(at Dec. 31 in thousands*)
Governmental
2023
Governmental
2024
Business-type
2023
Business-type
2024
Total Primary Government
2023
Total Primary Government 2024
REVENUES
Program revenues, primarily service charges
$ 105,116
$ 105,229
$ 261,232
$ 289,257
$ 366,348
$ 394,486
Sales & use taxes
178,229
203,397
-
-
178,229
203,397
Other general revenues
95,644
98,477
14,092
17,767
109,736
116,244
TOTAL REVENUES
378,989
407,103
275,324
307,024
654,313
714,127
Expenses
334,421
344,642
253,042
265,899
587,463
610,541
Transfers
2,540
5,587
( 2,540 )
( 5,587 )
-
-
CHANGE IN NET POSITION
47,108
68,048
19,742
35,538
66,850
103,586
Net position, beginning of year
1,210,253
1,257,361
905,695
925,437
2,115,948
2,182,798
NET POSITION, END OF YEAR
$ 1,257,361
$ 1,325,409
$ 925,437
$ 960,975
$ 2,182,798
$ 2,286,384
*Totals may not add due to rounding
-
Sales & Use Tax#
Many City services are funded through service charges, such as our Utility or Recreation services. However, the City assesses a 4.35% tax on sales, purchases and certain services in order to fund other services that are not charged based on volume or usage.
Base Rate - 2.85%
- Funds government services like police, transportation and administration.
General Fund Renewable - 0.25%
- EXPIRES DECEMBER 31, 2030
- This tax was passed by Fort Collins voters in April 2020 to continue funding services and programs residents value. This is also used in conjunction with the Base Rate to fund general government services.
Streets and Transportation - 0.25%
- EXPIRES DECEMBER 31, 2025
- Street maintenance taxes were first approved in 1984 and were renewed in 1989, 1998, 2006 and 2016. The Street Maintenance Program focuses on extending the lifespan of roadways and minimizing the cost of maintaining a viable road surface. Well maintained roads require less upkeep than repairing roads in poor condition, and this tax allows the City to maintain the current level of service.
Community Capital Improvement Program (CCIP) - 0.25%
- EXPIRES DECEMBER 31, 2025
- CCIP taxes were initiated in 1985 and were renewed in 1990, 1998, 2006 and 2016. Project highlights using this funding for 2016-2025 include Club Tico renovations, Downtown Poudre River Whitewater Park, a Visitors Center at the Gardens on Spring Creek, Willow and Linden Street improvements, Lincoln Avenue bridge, and a Southeast Community Center.
Natural Areas - 0.25%
- EXPIRES DECEMBER 31, 2030
- Open Space Yes!, originally passed in 1992 and renewed in 1998 and 2006, is a key component in the conservation and management of natural areas and trails. Expenditures from this tax include land acquisition, resource and land management, public improvements and educational programming.
Parks & Recreation, Transit and Climate 2050 - 0.50%
- EXPIRES DECEMBER 31, 2050
- Approved in 2023, this tax went into effect in 2024 and supports a variety of parks, recreation, transportation and climate programming. 50% of funding from this tax supports Parks and Recreation facilities, including pools. 25% funds greenhouse gas and air pollution reduction programming, and efforts to reach the City’s 2050 goal of community-wide carbon neutrality. The remaining 25% goes toward transit system infrastructure improvements and upgraded/expanded services.
![chart showing general and dedicated sales & use tax revenues]()
Dollar amounts in millions and reflect 2024 revenue
- $138.2M - Base Tax Rate, 2.85%
- $10.9M - General Fund Renewable, 0.25%
- $10.9M - Streets & Transportation, 0.25%
- $10.9M - Community Capital Improvement Program (CCIP), 0.25%
- $10.9M - Natural Areas, 0.25%
- $21.7M - Parks & Recreation, Transit and Climate 2050, 0.50%
-
Every two years, the City Manager submits a budget for City Council adoption. The proposed budget cannot include expenditures that exceed estimated reserve balances and anticipated revenue. The budget represents six months of input from residents, City staff and City management, and serves as the two-year blueprint for advancing results in the seven key outcome areas.
Fort Collins uses Budgeting for Outcomes (BFO) for its budget. The process focuses on results and priorities, not on cost. The process shifts from paying for costs to buying results. Service providers, or “sellers," make offers to results teams aligned behind one of the seven outcomes. Teams evaluate effectively purchasing these offers from the seller based on their priority. These purchase decisions put residents and their priorities first. For more information, please visit fcgov.com/BFO.
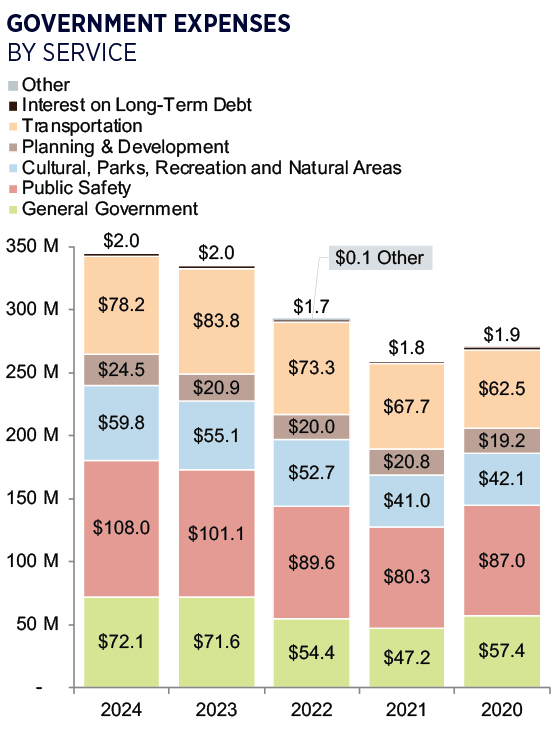
In 2024, governmental expenditure totaled $344.6 million, an increase of $10.2 million, or 3.1%, when compared to 2023. General Government and Public Safety expenses increased over 2023 by $0.5 million and $6.9 million respectively, while Transportation decreased by $5.6 million. The overall increase was largely due to expenses incurred by services provided to the City, or in use from grant and contribution revenues, alongside other City improvements. Additionally, Culture, Parks, Recreation and Natural Areas expenses increased by $4.7 million, also due to grant and contribution-related activity, as well as continuing economic growth seen in previous years. Planning and Development increased by a smaller margin of $3.6 million while Interest on Long-Term Debt remained flat, over the prior year.
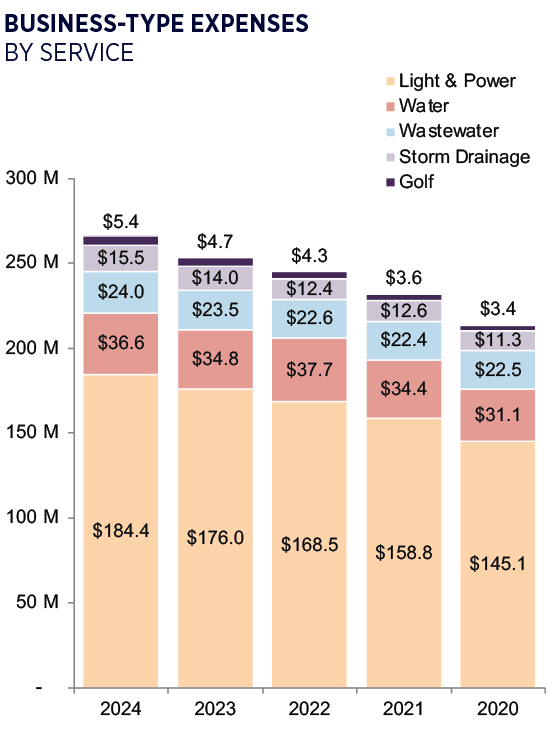
Business-type expenditures totaled $265.9 million in 2024, an increase of $12.9 million, or 5.1%, when compared to 2023. Increases seen over 2023 and previous years largely occurred in Light & Power expenses, growing by $8.4 million over the prior year, as expenses continue to rise for the Connexion internet service and other developments. While Water, Storm Drainage, Wastewater and Golf-related expenditures only increased over 2023 by $1.8 million, $1.5 million, $0.5 million, and $0.7 million, respectively, with increases in Business-type services driven mostly by inflationary pressures in energy cost, labor, equipment and supplies.
Government Expenses#
![chart showing 2019-2023 government expenses by service]()
Business-Type Expenses#
![chart showing 2019-2023 business-type expenses by service]()
Expenditures by Department#
Many expenditures of the City are segregated from other expenditures by a dedicated revenue source. Below is a breakdown by department of how proceeds from the various dedicated tax components are spent. Dedicated revenues, such as Keep Fort Collins Great, are contained to specified areas of spending by ballot language.
Figures presented are expressed in thousands; totals may not add due to rounding.
SERVICE AREA
Department
General Fund
Transportation Fund
Capital Projects Fund
Urban Renewal Authority
Other Gov. Funds
Grand Total
POLICE SERVICES TOTAL
$ 194,133
-
-
-
-
$ 194,133
Investigations
32,985
-
-
-
-
32,985
Police Information Services
31,428
-
-
-
-
31,428
Patrol
68,984
-
-
-
-
68,984
Special Operations
40,160
-
-
-
-
40,160
Police Administration
20,576
-
-
-
-
20,576
FINANCIAL SERVICES TOTAL
35,386
-
-
-
100
35,486
COMMUNITY & OPERATION SERVICES TOTAL
58,262
-
3,575
-
144,583
206,420
Recreation
60
-
116
-
33,276
33,452
Community Services Admin.
1,943
-
-
-
-
1,943
Cultural Services
1,954
-
1,702
-
29,711
33,366
Parks
52,642
-
663
-
24,323
77,629
Natural Areas
1,663
-
1,094
-
57,273
60,031
UTILITY SERVICES TOTAL
-
-
-
-
1,322
1,322
PLANNING, DEV. & TRANSP. TOTAL
45,349
126,283
53,087
-
100,160
324,879
PDT Administration
3,838
455
-
-
-
4,293
Parking Services
-
13
-
-
10,827
10,840
Transfort
-
-
283
-
82,004
82,287
Comm. Dev. & Neighborhood Services
38,435
-
-
-
-
38,435
FC Moves
-
5,583
1,573
-
846
8,002
Streets
3,077
89,953
(22)
-
3
93,011
Traffic
-
19,702
-
-
-
19,702
Engineering
-
10,577
51,252
-
6,480
68,309
EXECUTIVE SERVICES TOTAL
19,062
-
-
-
-
19,062
JUDICIAL SERVICES TOTAL
7,329
-
-
-
-
7,329
LEGAL SERVICES TOTAL
12,406
-
-
-
-
12,406
INFO. & EMPLOYEE SERVICES TOTAL
78,307
-
213
-
1,086
79,606
Information Technology
1,062
-
-
-
5
1,067
Comm & Public Involvement
11,951
-
-
-
0
11,951
Emergency Prep & Security
10,528
-
-
-
(1)
10,527
Human Resources
50,989
-
213
-
1,081
52,283
Operation Services
3,777
-
-
-
-
3,777
SUSTAINABILITY SERVICES TOTAL
35,121
-
198
18,089
10,355
63,763
Economic Health Office
3,652
-
-
-
734
4,387
Social Sustainability
14,480
-
-
-
9,185
23,666
Environmental Services
14,745
-
198
-
435
15,378
Sustainability Services Admin.
2,244
-
-
-
-
2,244
Urban Renewal Auth.
-
-
-
18,089
-
18,089
OTHER NON DEPT. TOTAL
10,364
-
-
-
18,800
29,164
POUDRE FIRE AUTHORITY TOTAL
116,181
-
-
-
1,974
118,155
GRAND TOTAL
$611,901
$126,283
$57,073
$18,089
$278,379
$1,091,726
-
CASH & INVESTMENT MANAGEMENT
Investment policies are governed by City Council-adopted policy. The principal objective of the City's cash and investment strategy is preservation of investment principal. Thus, the policy allows for only fixed-income investments, such as state or local government debt, U.S. agency obligations, or highly rated U.S. corporate debt. Equity investments, such as common stock or mutual funds, are disallowed under City policy.
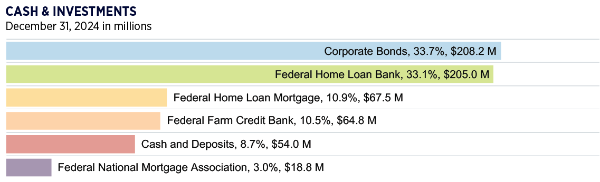
At Dec. 31, 2024, the fair market value of the City’s cash and investments was $618.3 million. The portfolio's overall market yield for 2024 was -4.16% and the realized and unrealized interest losses were $25.7 million.
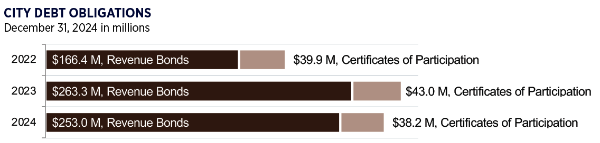
BONDED DEBT OBLIGATIONS
The City’s credit rating was Aaa by Moody’s Investors Service at Dec. 31, 2024. This highly favorable investment rating, maintained by less than 5% of governments, allows the City to pay less interest on its debt issuances. At Dec. 31, 2024, the City held total bonded debt of $291.2 million. Of this amount, $44.7 million was related to government activities and $246.5 million was related to business-type activities. The total of the City’s long-term obligations, which include all bonded debt, due within one year, is $38.8 million.
Cash & Investments#
![chart of 2024 cash and investment balances]()
Dec. 31, 2024 in millions
- $208.2M - Corporate Bonds, 33.7%
- $205.0M - Federal Home Loan Bank, 33.1%
- $67.5M - Federal Home Loan Mortgage, 10.9%
- $64.8M - Federal Farm Credit Bank, 10.5%
- $54.0M - Cash & Deposits, 8.7%
- $18.8M - Federal National Mortgage Association, 3.0%
City Debt Obligations#
![chart of 2022-2024 City debt obligations]()
-
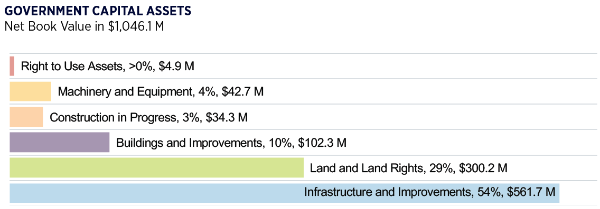
The book value, historical cost less depreciation, of the City’s capital assets totaled $1.9 billion at Dec. 31, 2024. This investment in capital assets includes buildings and improvements, infrastructure and other improvements, including streets, bridges, the full utility delivery system, land and right-of-way, various equipment and construction in progress. Total investment in capital assets increased $57.3 million compared to 2023.
While the City reports its assets at net book value based on acquisition cost and accumulated depreciation, estimated fair market value is 2-3 times higher due to market appreciation of water rights, land and building values. This estimate is based on appraisal value, replacement cost and/or insured values.
Government Capital Assets#
![chart describing 2024 government capital assets]()
Net Book Value $1,046.1M
- $4.9M, >0%, Right to Use Assets
- $42.7M, 4%, Machinery and Equipment
- $34.3M, 3%, Construction in Progress
- $102.3M, 10%, Buildings and Improvements
- $300.2M, 29% Land and Land Rights
- $561.7M, 54%, Infrastructure and Improvements
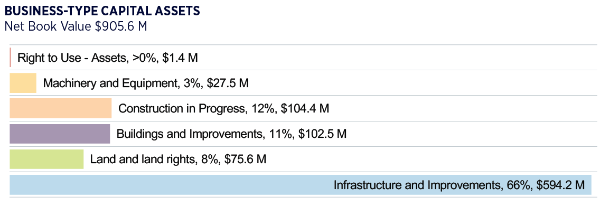
Business-Type Capital Assets#
![chart describing 2024 business-type capital assets]()
Net Book Value $905.6M
- $1.4M, >0%, Right to Use - Assets
- $27.5M, 3%, Machinery and Equipment
- $104.4M, 12%, Construction in Progress
- $102.5M, 11%, Building and Improvements
- $75.6M, 8%, Land and Land Rights
- $594.2M, 66%, Infrastructure and Improvements

Download 2024 Financial Reports#

2024 Popular Annual Financial Report
Download a printable PDF version of 2024 Popular Annual Financial Report (data posted above).

2024 Annual Comprehensive Financial Report
Download a PDF version of 2024 Annual Comprehensive Financial Report.